
BIO 2025 Report: U.S. Bioscience Industry Policy Guide for State Growth
State bioscience policy guidance highlights incentives, workforce programs, and public-private partnerships shaping industry growth.
- Publisher
- www.bio.org
- Length
- 23 pages
- File
- 0 B PDF
Quick answer
BIO 2025 Report: U.S. Bioscience Industry Policy Guide for State Growth is a 23-page whitepaper from www.bio.org covering US pharma intelligence. States are adopting phase-specific policy approaches tailored to company development stage, from discovery and seed through commercialization and maturity.
Why this matters
States are adopting phase-specific policy approaches tailored to company development stage, from discovery and seed through commercialization and maturity.
Executive summary
- States are adopting phase-specific policy approaches tailored to company development stage, from discovery and seed through commercialization and maturity.
- Financial tools—including R&D tax credits, grant matching programs, angel investor credits, and biomanufacturing incentives—reduce capital barriers for startups and growth-stage firms.
- Workforce initiatives, university-industry collaborations, and government partnerships form the foundation of sustainable bioscience ecosystems.
- Venture capital investment in biopharma rebounded in 2024 to $26 billion, up from $23.3 billion in 2023, signaling renewed confidence in the sector.
- Public bioscience company revenue grew 6.8% year-over-year in 2024 to $205 billion, demonstrating continued commercial strength.
AI research brief
State bioscience policy guidance highlights incentives, workforce programs, and public-private partnerships shaping industry growth.
Market Impact
| Regulatory | high |
|---|---|
| Commercial | high |
| Competitive | medium |
| Investment | high |
Who should read this
- Regulatory affairs teams
Ask about this report
AI-assisted answers grounded in NovaPharmaNews intelligence
Answers use retrieved site intelligence plus AI synthesis. Verify critical decisions with primary sources.
Download the full 23-page PDF
Free · 0 B · Instant access after email
Readers searching “Pdf the us bioscience industry 2022” usually want the BIO/CSBA state policy series and its economic companion data. Current BIO/CSBA releases plus BLS projections still show a multi-trillion-dollar footprint and faster demand for scientific R&D roles that states compete to host.
Key Takeaways
- BIO and CSBA reported more than $3.2 trillion in U.S. bioscience industry output for 2023 in their December 2024 economic-impact release.
- BLS May 2024 medians include $103,650 for biochemists/biophysicists and $106,950 for bioengineers/biomedical engineers.
- Scientific R&D employment is projected to grow 8.7% from 2024 to 2034, with biotechnology and medical research among demand drivers.
- Policy levers that matter for growth include R&D incentives, biomanufacturing cost relief, and workforce pipelines—not a single federal grant alone.
What does BIO/CSBA say about industry scale?
On December 2, 2024, BIO and CSBA announced via PR Newswire new national and state-level data on the U.S. bioscience industry’s economic performance. The release states that industry economic impact, measured as overall output, totaled more than $3.2 trillion in 2023.
That series is the quantitative companion many states use when arguing for bioscience incentives. Later BIO/CSBA “best practices” editions extend the conversation from size to policy design—R&D credits, manufacturing tax treatment, and early-stage capital tools—but economic-impact figures above are taken from the PR Newswire release, not from secondary blogs.
How do BLS wages frame the talent pitch?
State growth strategies often hinge on high-skill job quality. BLS Occupational Outlook Handbook medians for May 2024 include:
- Biochemists and biophysicists: $103,650 median pay; 35,600 jobs in 2024; 6% projected growth for 2024–34.
- Bioengineers and biomedical engineers: $106,950 median; 22,200 jobs; 5% projected growth.
- Microbiologists: $87,330 median; about 20,700 jobs; 4% projected growth (BLS OOH).
Those wage and outlook numbers help policymakers explain why bioscience clusters compete for talent with software and finance markets.
Where is employment growth concentrated?
BLS’s Monthly Labor Review overview of 2024–34 projections highlights research and development in the physical, engineering, and life sciences as a fast-growing industry, projecting 8.7% employment growth. The article ties demand to health- and biotechnology-related research, including pharmaceuticals, medical equipment, and diagnostics.
Occupations called out for related demand include medical scientists (except epidemiologists), biochemists and biophysicists, and bioengineers and biomedical engineers. For state strategy, that is a signal to pair capital incentives with training pipelines that feed scientific R&D employers.
What a practical state policy stack looks like
Across BIO/CSBA economic messaging and BLS labor data, the operable stack is familiar: refundable or transferable R&D tax support for pre-revenue firms, sales-tax relief on manufacturing and lab equipment, SBIR/STTR matching where states choose to amplify federal awards, and community-college or university pathways into technician and scientist roles. Exact state counts of each incentive change year to year and should be verified in the current legislative session before budgeting.
How investors should read the policy stack
For company diligence, state incentive menus matter most when they change cash timing: refundable R&D credits can fund payroll before revenue, while equipment sales-tax exemptions cut capex for first manufacturing suites. BLS wage data help stress-test whether a local hiring plan is competitive against coastal hubs paying above national medians.
Public bioscience company revenue growth cited in BIO/CSBA materials should be separated from early-stage venture conditions. A strong public-revenue year can coexist with selective private financing, so policy ROI arguments should not assume every local startup will raise on public-market terms.
What remains outside these sources
Neither the PR Newswire economic release nor BLS OOH tables by themselves prove which single incentive has the highest ROI in a given state. Site-selection decisions still turn on wet-lab inventory, permitting timelines, and local venture density that national aggregates cannot capture.
Older “Pdf the us bioscience industry 2022” editions remain useful for trend context, but 2023–2024 output and 2024–34 BLS projections should be preferred for current budget memos. Always confirm the edition year on the cover page before citing a state program as active law.
Related NovaPharma coverage
- Biotech coming of age: market analysis
- Biotech’s coming of age: AI, capital efficiency and China
- Weight Loss Medications in 2026: GLP-1 Market Shift
Frequently Asked Questions
How large is U.S. bioscience economic output in BIO/CSBA reporting?
In a December 2, 2024 PR Newswire release, BIO and CSBA reported that U.S. bioscience industry economic impact exceeded $3.2 trillion in overall output for 2023.
What do BLS data show for core bioscience occupations?
BLS Occupational Outlook figures for May 2024 show median pay of $103,650 for biochemists/biophysicists, $106,950 for bioengineers/biomedical engineers, and $87,330 for microbiologists.
Which workforce trend supports state bioscience policy?
BLS projects research and development in the physical, engineering, and life sciences to grow 8.7% from 2024 to 2034, with strong demand tied to health and biotechnology research.
Primary Sources
Frequently asked questions
What whitepapers does NovaPharmaNews publish?
Our research library curates FDA, EMA, and industry publisher PDFs — regulatory guidance, clinical analyses, manufacturing reports, and market intelligence. Each report includes an AI-summarized landing page with key takeaways and a gated PDF download.
How do I download a whitepaper?
Open any report page, scroll to the download form, and enter your work email. You receive instant PDF access and can opt in to weekly pharma intelligence updates. Downloads are free for healthcare professionals.
How do whitepapers connect to news and pipeline data?
Report pages link to related intelligence — company profiles, drug INN pages, clinical trials, pipeline programs, and topic hubs. Use the intelligence spokes on each page to explore the entity graph behind the research.
Ready to read the full report?
Join 12,000+ pharma leaders getting deep industry analysis delivered weekly.
Related topic hubs
Editorial coverage and intelligence directories for this report's beat.
Explore the intelligence platform
Related intelligence
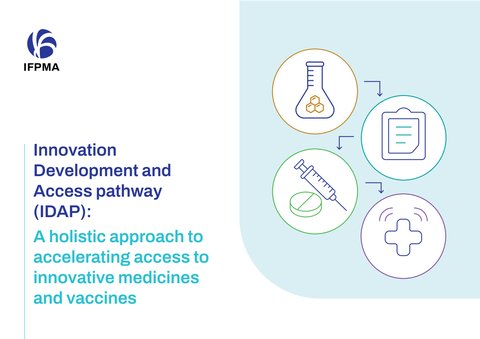 🔒
🔒 PDF Innovation Development and Access pathway
IDAP is a holistic framework spanning four linked phases: Research and Development; regulatory processes and product registration; listing, …
 🔒
🔒 IFPMA whitepaper: How assessment reports enable regulatory reliance in pharma
Regulatory reliance helps NRAs avoid duplicative reviews and allocate resources more efficiently by leveraging prior scientific evaluations …
 🔒
🔒 Integrated delivery networks in Middle East healthcare: what PwC says about the next phase of care
Scale creates value only when healthcare assets are connected through shared systems, referral flows and coordinated management disciplines