
America's Innovation Engine: Small and Mid-Sized Biotechs Drive U.S. Clinical Trials, FDA Filings
Small and mid-sized biotechs drive U.S. biotech employment, clinical trials, FDA filings, and most industry-sponsored R&D activity.
- Publisher
- www.bio.org
- Length
- 2 pages
- File
- 0 B PDF
Quick answer
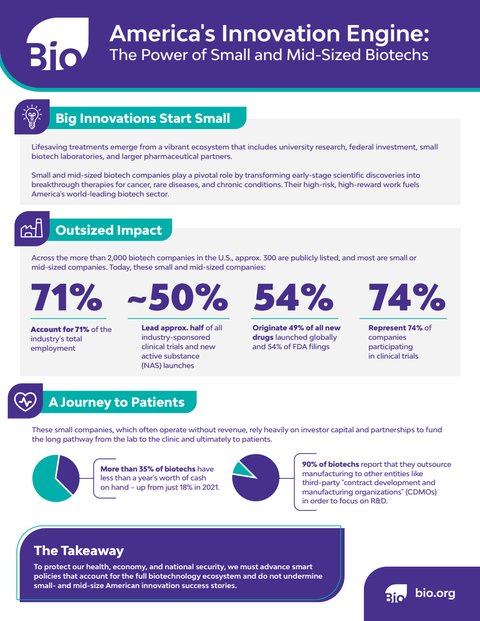
America's Innovation Engine: Small and Mid-Sized Biotechs Drive U.S. Clinical Trials, FDA Filings is a 2-page whitepaper from www.bio.org covering US pharma intelligence. Small and mid-sized biotechs represent approximately 99% of U.S. biotech business establishments and account for 71% of total industry employment.
Why this matters
Small and mid-sized biotechs represent approximately 99% of U.S. biotech business establishments and account for 71% of total industry employment.
Executive summary
- Small and mid-sized biotechs represent approximately 99% of U.S. biotech business establishments and account for 71% of total industry employment.
- These companies lead approximately 50% of all industry-sponsored clinical trials and originate 54% of FDA filings, demonstrating their outsized role in drug development pipelines.
- More than 35% of biotechs operate with less than one year of cash on hand, underscoring reliance on investor capital and strategic partnerships for survival.
- Approximately 90% of biotechs outsource manufacturing to contract development and manufacturing organizations (CDMOs) to concentrate resources on research and development.
- Policy frameworks must support the full biotech ecosystem without undermining the innovation capacity of smaller companies.
AI research brief
Small and mid-sized biotechs drive U.S. biotech employment, clinical trials, FDA filings, and most industry-sponsored R&D activity.
Market Impact
| Regulatory | high |
|---|---|
| Commercial | high |
| Competitive | medium |
| Investment | high |
Who should read this
- Regulatory affairs teams
Ask about this report
AI-assisted answers grounded in NovaPharmaNews intelligence
Answers use retrieved site intelligence plus AI synthesis. Verify critical decisions with primary sources.
Download the full 2-page PDF
Free · 0 B · Instant access after email
BIOR-0126-OP-1005 captures BIO’s America’s Innovation Engine message: small and mid-sized U.S. biotechs are not a fringe of the industry. They represent about 99% of biotech establishments, about 71% of employment, roughly half of industry-sponsored clinical trials, and about 54% of FDA filings, while often running on short cash runways.
Key Takeaways
- BIOR-0126-OP-1005 centers small/mid-sized firms as the U.S. early innovation engine.
- BIO figures cited in the brief: ~99% of establishments, ~71% of employment, ~50% of industry trials, ~54% of FDA filings.
- Typical small firms run 1–3 research programs; mid-sized firms often run a few clinical or early commercial programs.
- Capital access, partnered R&D, and manufacturing capacity remain the binding constraints.
What does BIOR-0126-OP-1005 claim about industry structure?
Across more than 2,000 U.S. biotech companies, only about 300 are publicly listed, and most firms are small or mid-sized. BIO’s brief places roughly 1,900–2,200 firms in the small-biotech band and about 120–180 in mid-size, versus roughly 25–40 large biopharma companies. That structure explains why employment and trial leadership skew toward smaller sponsors even though revenue concentrates in large commercial portfolios.
How do these firms shape clinical trials and FDA filings?
The brief attributes about half of industry-sponsored clinical trials and about 54% of FDA filings to small and mid-sized companies. It also cites participation figures such as about 74% of companies in clinical trials coming from this segment. Readers should treat those shares as BIO industry-analysis estimates, then verify live trial volume on ClinicalTrials.gov when sizing a specific indication.
What does FDA’s own pipeline context show?
FDA’s public novel-drug and biologics resources remain the authoritative check on filing and approval outcomes year by year. For cellular and gene therapy products specifically, FDA’s biologics pages track an expanding approved set after the first gene therapy in 2017. Cross-check product-class activity on the FDA cellular and gene therapy products page and broader CDER/CBER approval trackers when translating “share of filings” into therapeutic-area strategy.
Where do capital constraints show up?
BIO emphasizes that many small companies operate without product revenue and depend on investors and partnerships to fund the path from lab to clinic. Briefing materials around emerging-biotech finance also flag multi-year cash pressure for a large share of the sector. Public-company financing stress is often visible first in SEC EDGAR filings—shelf registrations, going-concern language, and collaboration agreements—before trial starts slip.
What should BD and policy teams take from BIOR-0126-OP-1005?
For business development, the brief supports sourcing innovation from partnered small sponsors rather than assuming large-cap internal discovery dominates early pipelines. For policy and manufacturing strategy, it links trial and filing leadership to capital-market and contract-manufacturing capacity. NIH remains a complementary public research funder; program maps are available via NIH.gov.
How should investors read the employment and trial shares?
Employment concentration in small and mid-sized firms does not mean those firms control commercial cash flow. Many employees support preclinical or early clinical programs that still need a larger partner for Phase 3, manufacturing scale, or U.S. launch. BIOR-0126-OP-1005 is therefore most useful as a map of where discovery and early development live, not as a forecast of who books the majority of branded product revenue in 2030.
What remains unproven
Industry-share statistics in trade association briefs are not the same as audited FDA census tables. Definitions of “small” and “mid-sized” vary across BIO, IQVIA, and Biomedtracker datasets. Claims that small biotechs “drive” every therapeutic area overstate the brief; oncology, rare disease, and chronic-disease mixes differ, and large sponsors still dominate many late-stage commercial launches.
Related NovaPharma coverage
- ReBEC Clinical Trial Registry Analysis: Brazil's 2020-2024 Trial Demographics
- $2M Gene Therapy Cures Need a Financing Model
- Ireland's Clinical Trials: A Comparative Analysis with EU Peers
Frequently Asked Questions
What is BIOR-0126-OP-1005 about?
BIOR-0126-OP-1005 refers to BIO’s America’s Innovation Engine brief on small and mid-sized biotechs. It argues these firms dominate U.S. biotech establishments and employment while originating a large share of clinical trials and FDA filings despite thin cash runways.
What share of FDA filings do small and mid-sized biotechs originate?
According to the BIO brief summarized as BIOR-0126-OP-1005, small and mid-sized companies originate about 54% of FDA filings and lead roughly half of industry-sponsored clinical trials, while representing about 99% of U.S. biotech business establishments and 71% of industry employment.
Why do capital and partnerships matter for these firms?
Many small biotechs operate with little or no product revenue and fund multi-year development with investor capital and partnered R&D. BIO’s brief highlights acute cash constraints for a large share of the sector, which makes financing conditions and manufacturing partnerships load-bearing for trial starts and filings.
Primary Sources
Frequently asked questions
What whitepapers does NovaPharmaNews publish?
Our research library curates FDA, EMA, and industry publisher PDFs — regulatory guidance, clinical analyses, manufacturing reports, and market intelligence. Each report includes an AI-summarized landing page with key takeaways and a gated PDF download.
How do I download a whitepaper?
Open any report page, scroll to the download form, and enter your work email. You receive instant PDF access and can opt in to weekly pharma intelligence updates. Downloads are free for healthcare professionals.
How do whitepapers connect to news and pipeline data?
Report pages link to related intelligence — company profiles, drug INN pages, clinical trials, pipeline programs, and topic hubs. Use the intelligence spokes on each page to explore the entity graph behind the research.
Ready to read the full report?
Join 12,000+ pharma leaders getting deep industry analysis delivered weekly.
Related topic hubs
Editorial coverage and intelligence directories for this report's beat.
Explore the intelligence platform
Related intelligence
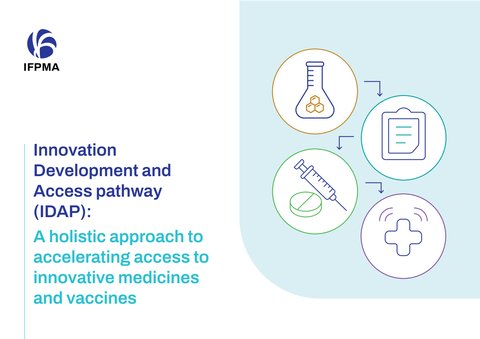 🔒
🔒 PDF Innovation Development and Access pathway
IDAP is a holistic framework spanning four linked phases: Research and Development; regulatory processes and product registration; listing, …
 🔒
🔒 IFPMA whitepaper: How assessment reports enable regulatory reliance in pharma
Regulatory reliance helps NRAs avoid duplicative reviews and allocate resources more efficiently by leveraging prior scientific evaluations …
 🔒
🔒 Integrated delivery networks in Middle East healthcare: what PwC says about the next phase of care
Scale creates value only when healthcare assets are connected through shared systems, referral flows and coordinated management disciplines