
EFPIA report: economic impact of industry clinical trials across Europe
Industry clinical trials generated €21.7bn GVA across the EEA in 2025, supported 165,000+ jobs, and may add more with trial growth.
- Publisher
- Nick Woolley
- Length
- 34 pages
- File
- 0 B PDF

Quick answer
EFPIA report: economic impact of industry clinical trials across Europe is a 34-page whitepaper from Nick Woolley covering EU pharma intelligence. Industry clinical trials created €10.1 billion in direct GVA and €21.7 billion in total GVA across the EEA in 2025, accounting for indirect and induced economic effects.
Why this matters
Industry clinical trials created €10.1 billion in direct GVA and €21.7 billion in total GVA across the EEA in 2025, accounting for indirect and induced economic effects.
Executive summary
- Industry clinical trials created €10.1 billion in direct GVA and €21.7 billion in total GVA across the EEA in 2025, accounting for indirect and induced economic effects.
- The sector supported more than 165,000 jobs across Europe, including over 45,000 clinical research positions and over 120,000 indirect and induced employment roles.
- Clinical trials are linked to prevention of 26.9 million sick days, valued at €10.4 billion of GVA through workforce productivity improvements.
- R&D spillovers from clinical research contribute an estimated €3.6 billion of additional GVA to the European economy.
- Three growth scenarios model potential gains of €4.0 billion to €17.9 billion in additional GVA if trial volumes increase by 11.1%, 25%, or 50% respectively.
AI research brief
Industry clinical trials generated €21.7bn GVA across the EEA in 2025, supported 165,000+ jobs, and may add more with trial growth.
Market Impact
| Regulatory | high |
|---|---|
| Commercial | high |
| Competitive | medium |
| Investment | high |
Who should read this
- EU market access specialists
Ask about this report
AI-assisted answers grounded in NovaPharmaNews intelligence
Answers use retrieved site intelligence plus AI synthesis. Verify critical decisions with primary sources.
Download the full 34-page PDF
Free · 0 B · Instant access after email
A Frontier Economics study commissioned by EFPIA quantifies what industry clinical trials add to Europe’s economy. The central figure is €35.7 billion in Gross Value Added in 2025—driven by trial activity, R&D spillovers, and avoided sick days—while Europe’s global trial share has fallen.
Key Takeaways
- Industry clinical trials contributed €35.7 billion GVA across Europe in 2025 (€21.7bn trial activity; €3.6bn R&D spillovers; €10.4bn productivity from 26.9 million avoided sick days).
- Activity supported about 165,000 jobs, including over 45,000 clinical research roles.
- Europe’s share of global industry-sponsored trials fell from 22% in 2013 to 12% in 2023 (IQVIA figures cited in the report).
- Meeting stated EU trial-growth targets is linked by EFPIA to about €4 billion extra yearly activity and roughly 35,000 additional patient places under the near-term scenario.
What does the EFPIA Frontier Economics report measure?
“The economic impact of industry clinical trials across Europe” was prepared by Frontier Economics for EFPIA. It estimates four linked impacts: direct/indirect/induced GVA from trial spend, R&D spillover GVA, productivity gains from healthier workers, and scenario analysis if Europe wins more trials.
The headline stack for 2025 is €35.7 billion total GVA. Trial activity alone accounts for €21.7 billion across the EEA once indirect and induced effects are included (€10.1 billion direct GVA inside that total).
How large are jobs, spillovers, and sick-day gains?
According to the same PDF:
- About 45,000 people were directly employed in clinical research across the EEA in 2025; total employment rises to about 165,000 including supply-chain and induced effects.
- R&D spillover GVA is estimated at about €3.6 billion for the EEA, with Germany above €1 billion and Belgium and France each above €600 million.
- Avoided sick days are estimated at 26.9 million, valued at €10.4 billion GVA.
Germany leads EEA trial-related GVA in the country tables, with almost €6.3 billion total GVA from clinical trial activity.
Why does the decline in Europe’s trial share matter?
The report cites IQVIA data showing Europe’s share of global industry-sponsored trials fell from 22% in 2013 to 12% in 2023 even as global trial numbers rose. That decline is the policy backdrop for EFPIA’s growth scenarios.
EFPIA’s accompanying statement says an about 11% rise in trials—aligned with Commission/EMA/HMA targets—could mean around 35,000 more patients gaining trial access, about €4 billion extra yearly economic activity, about 18,000 jobs, and about three million fewer sick days. Larger +25% and +50% scenarios scale benefits to €8.9 billion and €17.9 billion incremental GVA respectively.
How should BD teams use the country tables?
The Frontier Economics PDF breaks GVA into direct, indirect, and induced components and shows large absolute contributions in Germany, with meaningful spillover clusters in Belgium and France. Those tables help prioritise where operational trial footprint and economic narrative reinforce each other, but they do not substitute for site-level feasibility work.
For licensing or build-vs-buy questions, pair the EFPIA aggregate with protocol timelines, ethics-committee throughput, and comparator access. A high national GVA figure can coexist with slow start-up for a specific indication if investigators or imaging capacity are constrained.
What remains model-dependent
GVA, spillover, and sick-day valuations depend on Frontier’s modelling assumptions and input datasets. They are not the same as audited national accounts for “clinical trials” as a single industry code. Competitive read-through for any one sponsor still requires protocol-level and country operational data beyond the EFPIA aggregate.
Scenario uplifts (+11%, +25%, +50%) are policy illustrations, not forecasts. If Europe fails to reverse the 2013–2023 share decline, the incremental €4–17.9 billion GVA cases do not materialise. Conversely, meeting targets would still leave China and the U.S. as the global reference points the report uses for ambition framing.
Related NovaPharma coverage
- EMA and African regulators on Ebola clinical trials
- EFPIA AI across the medicines lifecycle
- EMA approved 104 human medicines in 2025
Frequently Asked Questions
What total GVA does the EFPIA Frontier Economics report attribute to industry trials?
The report estimates industry clinical trials contributed €35.7 billion in Gross Value Added across Europe in 2025, combining trial-activity GVA, R&D spillovers, and productivity gains from avoided sick days.
How many jobs do industry clinical trials support in Europe?
Industry clinical trial activity supported about 165,000 jobs across Europe in 2025, including over 45,000 clinical research jobs and over 120,000 indirect and induced jobs.
What growth scenario is tied to EU trial targets?
EFPIA’s related statement says meeting an about 11% rise in trials could add roughly €4 billion a year in economic activity, about 18,000 jobs, and prevent about three million sick days, alongside access for about 35,000 more patients.
Primary Sources
Frequently asked questions
What whitepapers does NovaPharmaNews publish?
Our research library curates FDA, EMA, and industry publisher PDFs — regulatory guidance, clinical analyses, manufacturing reports, and market intelligence. Each report includes an AI-summarized landing page with key takeaways and a gated PDF download.
How do I download a whitepaper?
Open any report page, scroll to the download form, and enter your work email. You receive instant PDF access and can opt in to weekly pharma intelligence updates. Downloads are free for healthcare professionals.
How do whitepapers connect to news and pipeline data?
Report pages link to related intelligence — company profiles, drug INN pages, clinical trials, pipeline programs, and topic hubs. Use the intelligence spokes on each page to explore the entity graph behind the research.
Ready to read the full report?
Join 12,000+ pharma leaders getting deep industry analysis delivered weekly.
Related topic hubs
Editorial coverage and intelligence directories for this report's beat.
Explore the intelligence platform
Related intelligence
 🔒
🔒 EFPIA W.A.I.T Indicator 2026: 597-day waits
Full availability on public reimbursement lists stands at 28%, down from 29% in the 2024 study, indicating a declining trend in unrestricted…
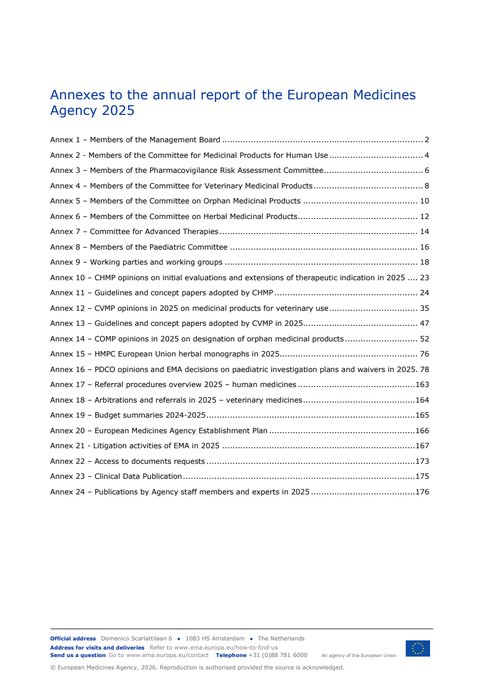 🔒
🔒 EMA 2025 Annual Report Annexes: Committees, Opinions, and Governance
The document comprises 24 annexes documenting EMA committee memberships, 2025 scientific opinions, and regulatory decisions across human and…
 🔒
🔒 Healthcare investment in Central and Eastern Europe: what pharma teams should know
CEE governments invested an average of 5.47% of GDP in healthcare in 2023, compared with 8.17% in the EU4 (Germany, France, Italy, Spain). T…